


Table of Contents
![]()
1. What is Bleuet de BREW?
Bleuet de BREW is the world's first profiling tool, for BREW applications written in C and C++, that automatically measures the execution time or the memory usage during execution and represents the results with a GUI.
By using Bleuet, speed and memory bottlenecks in BREW applications can be easily identified.
![]()
2. System Requirements
| Operating System | Windows XP / 2000 |
|---|---|
| BREW SDK | All version in all languages |
| ARM Compiler | RVCT for BREW 1.2 |
| Required Software | BREW AppLoader |
| Recommended Softaware | Perl ( ActivePerl build 5.6.1.638 is recommended. Auto-transfer function does not work on build 5.8.8.817 ) |
* The Perl environment automatically transfers MOD files to the handset. Mod files can be manually transfered using the BREW AppLoader.
![]()
3. How to Profile
A license file named "licence.dat", is issued through email by Sophia Cradle Incorporated, and should be saved in the same folder as "Bleuet.exe".
3.1 Building the MOD File
3.1.1 Setting the Automatic MOD File Transfer
If the Perl environment is installed, from the menu bar, select [Project]->[Settings]. Then check the [use automatic perl] option and also also specify the correct [COM port] number.
3.1.2. Selecting ELF file
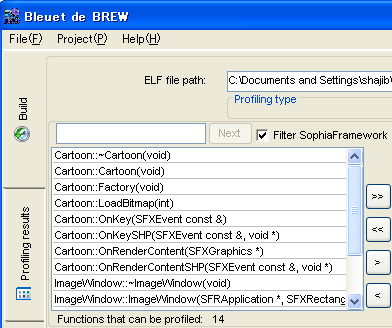
Select the [Build] tab to view the build screen.
The path of the target application's ELF file is specified in [ELF file path].
* ELF file generation is not explained here. See for ARM user manual for help.
3.1.3. Choosing Profiling Type
Either [Speed] or [Memory] may be chosen as profiling type.
- [Speed]: Monitors how long it takes each function to execute.
- [Memory]: Monitors how much memory is consumed by each function during execution.
3.1.4. Choosing Functions to Profile
Functions to be profiled are chosen or can be looked up from the [Functions that can be profiled] list box. Single functions are transferred with the [>] button, or by double-clicking them.
 Transfers all profilable functions to the [Functions to profile] list box.
 Transfers all functions in [Functions to profile], back to [Functions that can be profiled]
![]() Transfers the selected functions to the [Functions to profile] list box.
Transfers the selected functions to the [Functions to profile] list box.
![]() Transfers selected functions from [Functions to profile], back to [Functions that can be profiled]
Transfers selected functions from [Functions to profile], back to [Functions that can be profiled]
If the [Filter SophiaFramework] option is checked the internal functions of SophiaFramework are filtered and not displayed in [Functions that can be profiled].
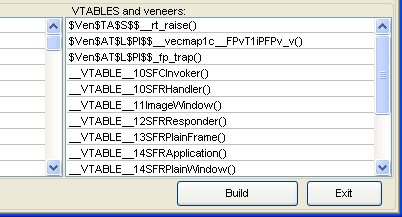
Any VATBLES and veneers within the selected ELF file are displayed in the [VTABLES and veneers] box.
*1 Thumb codes and functions consisting of one instruction cannot be profiled and are displayed in the [Not profilable functions] list box.
*2 Profiling time is proportional to the number of functions in [Functions to profile]. If profiling takes too long, decrease the number of selected functions.
3.1.5. Build
Once all functions have been selected, pressing the [Build] button generates the new MOD file in the same folder as the selected ELF file.
An [Injector output messages] window pops up, and displays the decoding progress. This window is automatically closed when the [Profiling results] tab is chosen.
A "functions.txt" file with the names of functions to be profiled and their assigned IDs is generated in the same folder as Bleuet de BREW, and is used when displaying profiling results.
![]()
3.2. Getting the Log File
The following are required to generate a log file.
- MOD, MIF and SIG files
- BREW handset for development and cable
- BREW AppLoader
3.2.1. Transferring the MOD file
When [use automatic perl] is enabled, a pop up dialog automatically transfers the MOD file to the device. It is also possible to transfer the MOD file manually with the BREW AppLoader.
MIF and SIG files must be transferred using the BREW AppLoader.
3.2.2. The Log File
Bleuet de BREW injects "ILOGGER_Printf" code at the head and tail of each profiled function and this code generates profiling data during execution.
Profiling information is saved in "Bleuet.log" contained in the application folder on the device. Bleuet.log must be transferred from the device to the PC in order to view the profiling results.
Incomplete log data is automatically removed from the file.
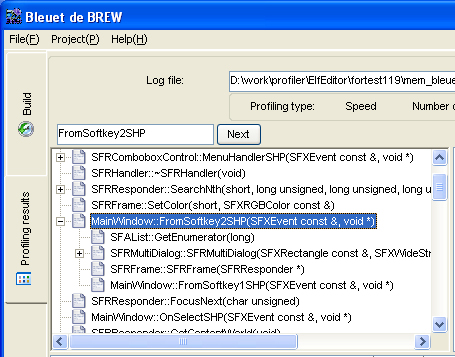
The unfiltered log output can be seen by pressing the [View Full Function Calling Order] button.
![]()
3.3. Analyzing the Log File
Selecting the [Profiling results] tab displays the screen with the profiling results.
3.3.1. Select Log File
Profile results are displayed once the path of the target log file is specified in [Log file].
The profiling results refer to the "functions.txt" file which is rewritten every time a MOD file is built. So only the most recently generated MOD file can be profiled.
3.3.2. Profiling Results: [Speed]
Upper left tree view box
A tree structure showing the hierarchy of functions selected as [Functions to profile] is generated.
Profiling Results Graph
Pressing the [Chart View] button generates a graphical representation displaying the percentage of time taken by each function, from the total execution time of all sub functions.
Statistics Table
- [Function name]:Name of the profiled function.
- [Time]: Function's required execution time (in ms) without its sub functions.
- [SubFunc time]: Time required to execute the selected function's sub functions.
- [Hit Count]: Number of times the function was executed during the logging.
- [Average time]: Average time required to execute the function.
- [% from total time]: Percentage of time required by each function, from the total execution time of all sub functions combined.
3.3.3. Profiling Results : [Memory]
Upper left tree view box
A tree structure showing the hierarchy of functions selected as [Functions to profile] is generated.
Profiling Results Graph
Pressing the [Chart View] button generates a graphical representation displaying the percentage of memory consumed by each function, from the total consumed memory of all sub functions.
Statistics Table
- [Function name]: Name of the profiled function.
- [Memory]: Amount of memory ( in bytes ) used by the function without its sub functions.
- [SubFunc memory]: Amount of memory used by the sub functions of the selected function.
- [Hit Count]: Number of times the function was executed during the logging.
- [Average memory]: Average memory required to execute the function.
- [% from total memory]: Percentage of memory used by each function, from the total consumed memory of the sub functions.
![]()
4. Reference
4.1 Operating Instructions
4.1.1. Menu
[File]
[Project]

- [Settings]:
If the Perl environment is installed, check the [use automatic perl] option and specify the [COM port] number the mobile handset is connected to.
[Help]
- [Profiler help]: Opens "Bleuet de BREW -User Manual-"
- [About]: Displays version and license information.
4.1.2. [Build Pane]
Parameters of [Build Pane]
- [ELF file]: Select ELF file generated by ARM compiler.
- [Profiling type]: Can profile from aspect of [speed] or [memory].
- [Functions that can be profiled]: All profilable functions are listed in this box.
- [Functions to profile]: All funcions selected for profiling are listed in this box.
- [Loaded functions total]: The number of functions from ELF file that Bleuet succeeded to load.
- [Thumb]: The number of functions from ELF file that contain thumb code.
- [VTABLES]: The number of VTABLES in the ELF file.
- [Functions to profile]: Total number of functions to profile.
- [Not profilable functions]: List of non profilable functions.
- [VTABLES and veneers]: Lists up VTABLES and veneers in the ELF file.
- [Build]: Builds MOD file for profiling.
- [Exit]: Quits Bleuet
4.1.3. [Profiling Results] Pane
Parameters of [Profiling Results] Pane
- [Log file]: Select a log file generated by BREW Logger.
- [Profiling type]: With regard to which aspect the profiling was done.
- [Number of profiled functions]: Total number of profiled functions.
- [Chart View]: The profiling results are displayed graphically.
- [View full function calling order]: Lists the full function calling order.
memory : 2943292 : AEEMod_Load funcion end


*[profiling done for memory : current memory size 2943292, when execution of AEEMod_Load function ended].
time : 2943292 : AEEMod_Load function end
*[profiling was done for time : device time 2943292 ms, when execution of AEEMod_Load function ended]. - [Export to csv]: The profiling results are exported to a csv file.
- [Exit]: Quit Bleuet.
![]()
4.2 Error Messages
- Message: Can't open ELF file
Cause: The selected ELF file is not a valid ELF file.
Solution: Build a new ELF file using ARM compiler. - Message: ELF file loading error
Cause:Corrupted or invalid ELF file.
Solution: Build a new ELF file using ARM compiler. - Message: No functions to be profiled
Cause: No functions were selected for profiling.
Solution: Select functions to profile. See 3.1.4. Selecting functions for help. - Message: Unable to open the functions.txt profiling file
Cause: Functions.txt is not in the same folder as Bleuet.exe.
Solution: Build a new MOD file. See 3.3.1. Selecting log file for help. - Message: Unable to open the log file
Cause: Either log file is broken, or the selected log is not generated by the MOD file built by Bleuet.
Solution: The valid log file is the one generated by the MOD file built by Bleuet. - Message: Can't find the help file
Cause: Bleuet_help.chm is not in the same folder with Bleuet.exe.
Solution: Put Bleuet_help.chm in the same folder as Bleuet. - Message: Failed to execute the perl script.
Cause: Perl is not installed as your environment.
Solution: Install Perl, or do not use the automatic copy function. See 3.1.1. Settings for help.
![]()